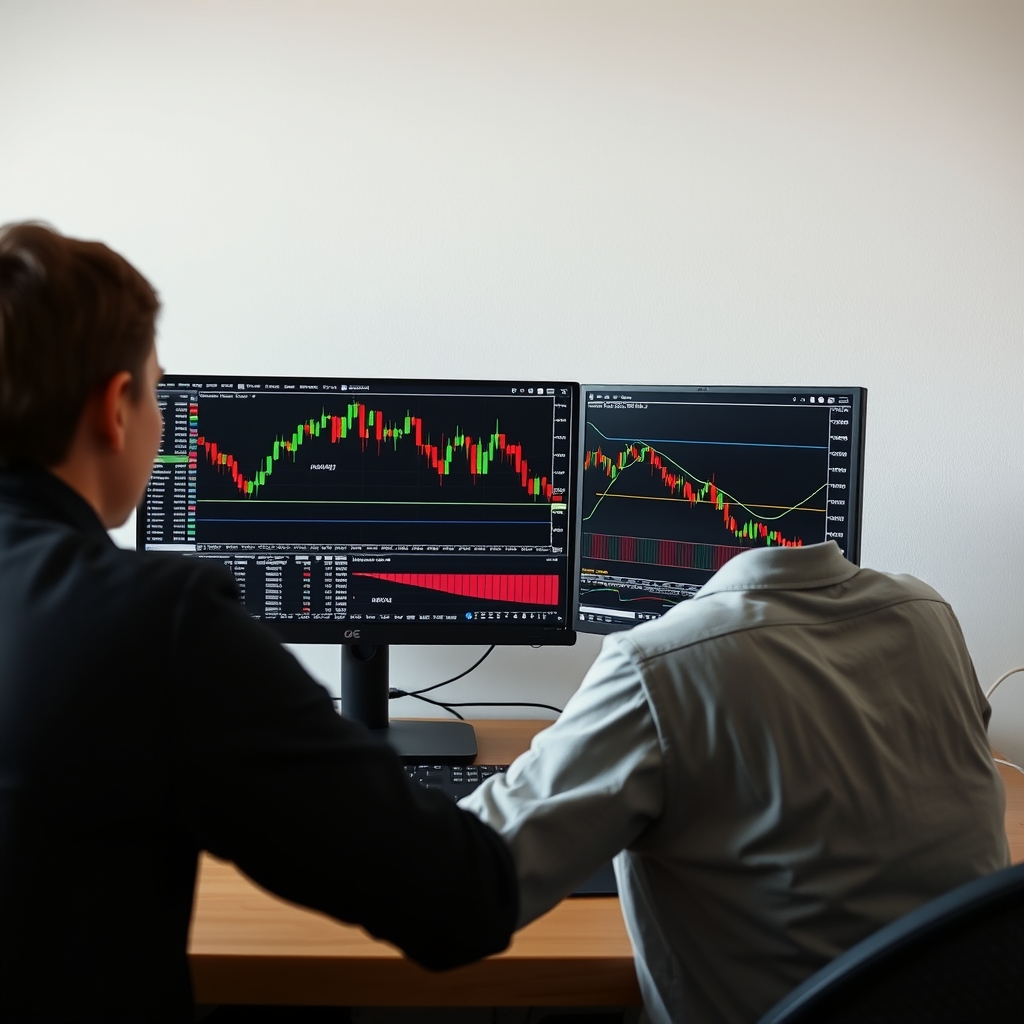
Most indicator sales pages show you a handful of winning trades and call it proof. A backtest is how you replace that with your own evidence. It will not tell you the future, but it can quickly rule out indicators that never had an edge. This guide covers three ways to test: manual, the MetaTrader Strategy Tester, and dedicated software. It also covers what each can and cannot show you. For the wider safety framework, see Testing & Using Indicators Safely.
Before you test anything
Write the rules down first
If you cannot state the rules in plain language, you cannot test them. Define these before you open a chart:
- Entry: the exact signal, and whether you enter on the signal candle's close or the next open.
- Stop loss and exit: fixed pips, ATR-based, opposite signal, or a target.
- Pairs, timeframe and sessions you will test.
- Costs: spread, commission and slippage assumptions.
Changing rules halfway through because results look bad is the most common way testers fool themselves.
Check for repainting first
If an indicator redraws past signals, every historical test is flattering fiction. Run a repainting check before investing hours in a backtest. Our guide Repainting Indicators Explained walks through it, and the Best Non-Repainting Forex Indicators page compares options that have been checked.
Method 1: Manual backtesting
You scroll back in time, hide the future candles, and record each signal as if it were live.
Steps
- Pick a chart and cover everything to the right of your starting point (or use replay mode if your platform offers one).
- Advance one candle at a time. Log only signals that meet your written rules.
- Record entry, stop, exit, result in R-multiples (multiples of your initial risk), and notes.
- Subtract realistic spread and commission from every trade.
- Repeat across different market conditions: trends, ranges, high-volatility news periods.
Tradeoffs
Manual testing is free and teaches you how the indicator behaves. It is also slow, and hindsight bias creeps in, especially when you have already seen the chart. It suits discretionary systems and small first-pass checks, not large samples.
Method 2: MetaTrader Strategy Tester
If the indicator is available for MT4 or MT5, you can wrap it in an Expert Advisor, or use a visual-mode test, and run it over historical data.
Steps
- Confirm the indicator can be tested. Many indicators draw arrows but expose no values to an EA, so you may need a developer or a different approach.
- Download the best historical data you can. Poor tick data produces misleading results.
- Set realistic spreads (not zero) and the modelling mode appropriate to your timeframe.
- Run the test, then examine the trade list, not just the equity curve.
- Re-run on a separate period you did not use while adjusting settings (out-of-sample).
Tradeoffs
It is fast and repeatable, but results depend on data quality, and the built-in optimizer makes curve-fitting easy. An optimized result that only works with one exact setting is a warning sign, not a discovery.
Method 3: Dedicated backtesting software
Platforms built for testing, such as TradingView's strategy tester or standalone tools, offer faster iteration, better reports and sometimes tick-level data. Features, data coverage and pricing differ and change, so confirm current details on each official site rather than relying on a third-party summary. Note that a platform's own version of an indicator may calculate differently from the one you plan to buy.
 Recommended for youDemo Testing and Forward Testing a Forex Indicator: Duration, Records to Keep and When to Go Live
Comparing the methods
| Factor | Manual | Strategy Tester | Dedicated software |
|---|---|---|---|
| Speed | Slow | Fast | Fast |
| Sample size practical | Small | Large | Large |
| Main risk | Hindsight bias | Bad data, over-optimizing | Indicator code differs from the one you buy |
| Technical skill | Low | Moderate | Varies |
Reading the results honestly
- Sample size: a few dozen trades says little. See how many trades you need for a reliable backtest.
- Drawdown: ask whether you could actually sit through the worst losing stretch.
- Win rate and profit factor: extreme numbers usually mean an error or overfitting. Context is in what is realistic.
- Consistency: does it hold across pairs and periods, or rely on one lucky stretch?
Compare your numbers with the vendor's. A large gap is informative; spotting exaggerated claims explains common red flags.
Common mistakes
- Ignoring spread and slippage, which can erase a thin edge.
- Testing only the pair and period where it looks best.
- Tweaking settings until the past looks perfect.
- Treating a backtest as proof rather than a filter.
What comes next
A decent backtest only earns the indicator a trial. Move to demo and forward testing to see how it behaves live, and settle your stops and risk per trade using position sizing and risk management. If you are still choosing candidates, start with the non-repainting comparison linked above, and confirm current pricing, refund terms and features on each official site before buying.
Note: Trading leveraged forex carries a high risk of loss, and past results, including backtests, do not predict future performance. This is educational content, not financial advice; consider speaking with a licensed professional about your situation.
Keep reading
 Repainting Indicators Explained: How to Spot and Test for Repainting and Lookahead BiasA repainting indicator changes its past signals after the fact. On a finished chart, it looks like…
 Spotting Exaggerated Forex Indicator Claims: Fake Win Rates, Cherry-Picked Screenshots and Sales Red FlagsMost exaggerated indicator claims fall apart under a few ordinary questions. This guide covers the…
 Position Sizing and Risk Management with Forex Indicators: Stops, Risk per Trade and CalculatorsAn indicator tells you when it would enter. It does not tell you how much to risk, and that second…