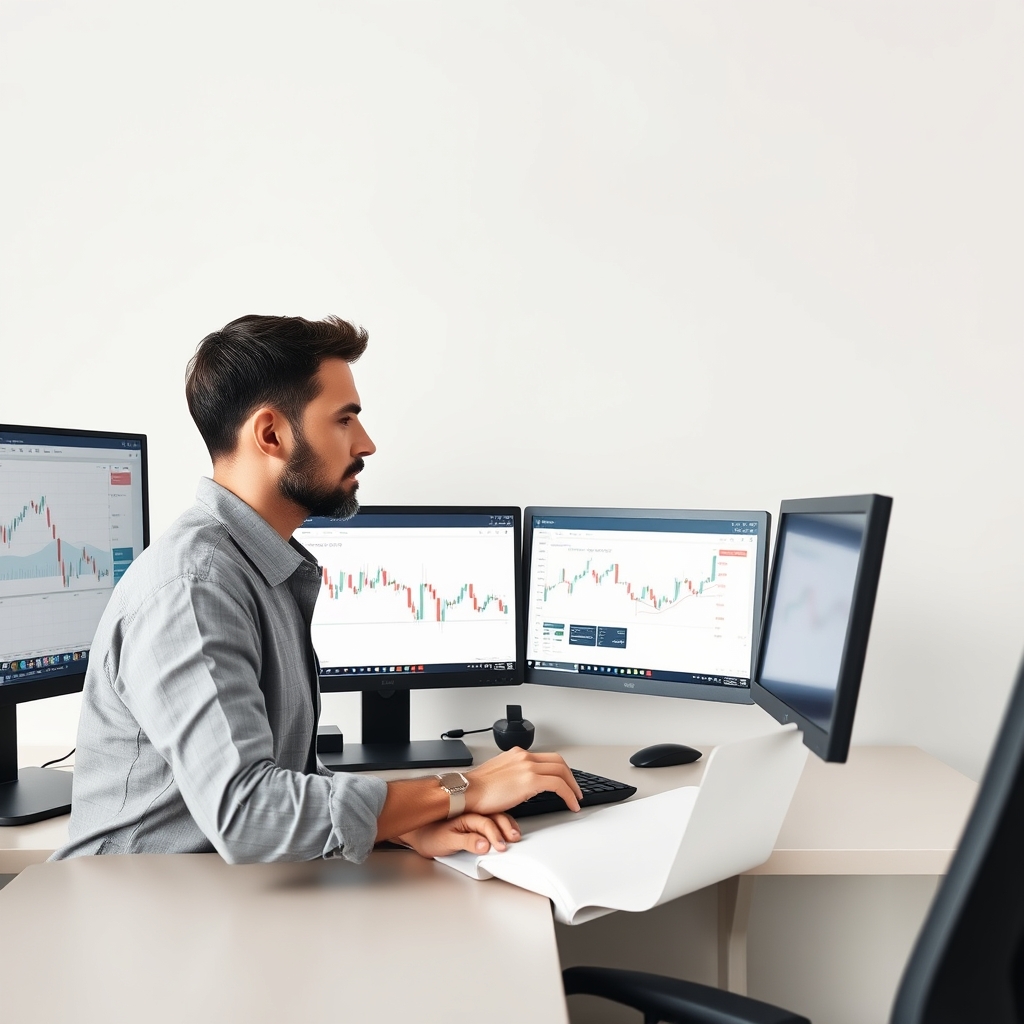
A backtest tells you how an indicator would have behaved on history you can see. Demo and forward testing tell you how it behaves on data that did not exist when you set your rules. That second question matters most, because it is where repainting, curve-fitting and unrealistic execution assumptions tend to surface. Nothing here guarantees a result, since a good forward test only lowers the odds of an unpleasant surprise. For the wider safety framework, see Testing & Using Indicators Safely.
Where Forward Testing Fits
Do things in this order:
- Screen the claims. Check the vendor's marketing against common exaggerated claims and red flags.
- Check for repainting. Use the methods in Repainting Indicators Explained. Skipping this step makes every later test meaningless.
- Backtest. Follow How to Backtest a Forex Indicator Before You Buy.
- Forward test on demo. This is the stage this page covers.
- Go live small, with risk you can afford to lose.
Before You Start: Write the Rules Down
Forward testing only works if the rules are fixed before the first trade. If you adjust settings after each loss, you are optimizing again, not testing. Write down:
- Pair(s) and timeframe(s)
- Exact entry trigger (for example, "enter at the open of the bar after the signal bar closes")
- Stop-loss and take-profit method
- Risk per trade (see position sizing and risk management)
- Sessions or news periods you will skip
- What counts as a skipped trade, and why that is allowed
Date the document and do not edit it mid-test. If you change something, start a new test log.
How Long Should You Forward Test?
There is no universal number, and anyone giving you one with confidence is guessing. Two things matter, and both must be satisfied: enough trades and enough variety in market conditions.
Trade count
Small samples are noisy. A strategy with a genuine edge can lose ten in a row, and a useless one can win ten in a row. Our guide on how many trades you need covers the sample-size logic. Forward test samples are usually smaller than backtests, so treat them as a consistency check, not proof.
Time and conditions
A fast scalping setup on a busy pair might produce a meaningful trade count in a few weeks. A swing system on H4 or daily charts may take many months. As a practical guide, aim to include at least one trending stretch, one ranging stretch, and a few high-impact news events. If your demo period was all one regime, say so in your notes and treat the conclusions as limited.
Records to Keep
A screenshot gallery is not a record. Use a spreadsheet or journal with one row per trade:
- Date and time (with your timezone noted), pair, timeframe, direction
- Signal time versus actual entry time
- Intended entry price versus filled price
- Stop, target, position size, and spread at entry
- Exit price, reason for exit, result in pips and in account currency
- Result in R (profit or loss divided by the amount you risked)
- Whether you followed the rules, with a note if you did not
- A screenshot taken at signal time, not afterward
The signal screenshot is your repainting check in real time. If the arrow on the chart now differs from the one you captured, you have learned something important.
Metrics to calculate
- Win rate, average win, average loss, and profit factor
- Maximum drawdown and longest losing streak
- Expectancy per trade in R
- Comparison against your backtest on each of the above
Win rate alone says little. For context on what is plausible, read realistic win rate and profit factor. Be wary of results that look too good, because that usually points to a testing flaw.
 Recommended for youHow to Backtest a Forex Indicator Before You Buy: Manual, Strategy Tester and Software Methods
The Honest Limits of Demo
Demo accounts are useful but flattering in several ways:
- Fills: Demo often fills at the quoted price with little slippage, especially around news.
- Spreads: They may be tighter or more stable than on a live account. Compare with your broker's live spreads.
- Psychology: No real money means no real hesitation. Many traders skip signals or move stops once money is at stake.
Because of these gaps, a demo result is best read as a ceiling, not a forecast. Subtract some performance in your head, and expect live results to differ.
Comparing Backtest and Forward Results
| Observation | Possible meaning | Next step |
|---|---|---|
| Forward results close to backtest | Rules may be robust, though sample is still limited | Extend the test or go live at minimal risk |
| Forward much worse | Repainting, overfitting, or a changed market regime | Re-run repainting checks; do not tweak and retest on the same data |
| Forward much better | Luck, a favorable regime, or flattering demo fills | Keep testing; do not raise risk |
| Many missed or altered trades | The rules are hard for you to follow | Simplify the rules or reconsider the tool |
When to Go Live
Consider moving to a live account only when all of these are true:
- The indicator passed repainting checks.
- You reached a sample size you can defend and covered more than one market condition.
- You followed your written rules on nearly every trade.
- Forward results are broadly consistent with the backtest, with drawdown you could tolerate in real money.
- Your risk per trade is small enough that a long losing streak will not force you to abandon the plan.
Then start with the smallest size your broker allows and treat the first live period as a further test. Set a pre-agreed stopping point, such as a maximum drawdown at which you pause and review.
Choosing What to Test
If you have not picked an indicator yet, start with tools that have verifiable non-repainting behavior. Our non-repainting indicator comparison is a sensible shortlist. Confirm current pricing, trial terms and any refund policy on the official site before you buy, as these change.
Trading leveraged products carries a real risk of loss. This page is educational and not personal financial advice. If you are unsure whether trading suits your circumstances, consider speaking with a qualified financial professional.
Keep reading
 Repainting Indicators Explained: How to Spot and Test for Repainting and Lookahead BiasA repainting indicator changes its past signals after the fact. On a finished chart, it looks like…
 Spotting Exaggerated Forex Indicator Claims: Fake Win Rates, Cherry-Picked Screenshots and Sales Red FlagsMost exaggerated indicator claims fall apart under a few ordinary questions. This guide covers the…
 Position Sizing and Risk Management with Forex Indicators: Stops, Risk per Trade and CalculatorsAn indicator tells you when it would enter. It does not tell you how much to risk, and that second…